The BNPL Logistics Ripple Effect: How Buy Now Pay Later's $122 Billion Boom Is Creating New Fulfillment Complexity and Returns Patterns

Buy Now Pay Later has conquered the checkout page. Klarna, Affirm, Afterpay, and a growing roster of fintech players have turned installment purchasing into a standard feature of online retail. But while the payments industry celebrates adoption milestones, supply chain teams are grappling with a less visible consequence: BNPL is fundamentally reshaping how goods move through fulfillment networks — and especially how they come back.
With U.S. BNPL gross merchandise volume projected to hit $122.3 billion in 2025 — up 10.9% year-over-year — the payment method is no longer a niche checkout option. It's a structural force that logistics teams must plan around, from forward fulfillment through the reverse supply chain.
The Try-Before-You-Commit Economy
BNPL's core appeal is friction reduction. Splitting a $200 purchase into four interest-free payments lowers the psychological barrier to buying. But that same friction reduction has a downstream effect that payment providers rarely discuss: it also lowers the barrier to returning.
Industry data consistently shows that BNPL orders carry return rates two to three times higher than traditional credit card or debit purchases. The reason is behavioral, not financial. BNPL enables a "try before you commit" shopping pattern — consumers order multiple sizes, colors, or styles with the implicit plan of returning what doesn't work. In fashion and apparel, this bracketing behavior has surged alongside BNPL adoption, with some retailers reporting that over 40% of BNPL orders in clothing categories include at least one item destined for return.
This isn't just a payments problem. It's a logistics problem. Every additional return creates a reverse freight movement, a warehouse receiving touchpoint, a quality inspection step, a restocking decision, and a potential markdown if the item can't be resold at full price.
The Returns Avalanche in Numbers
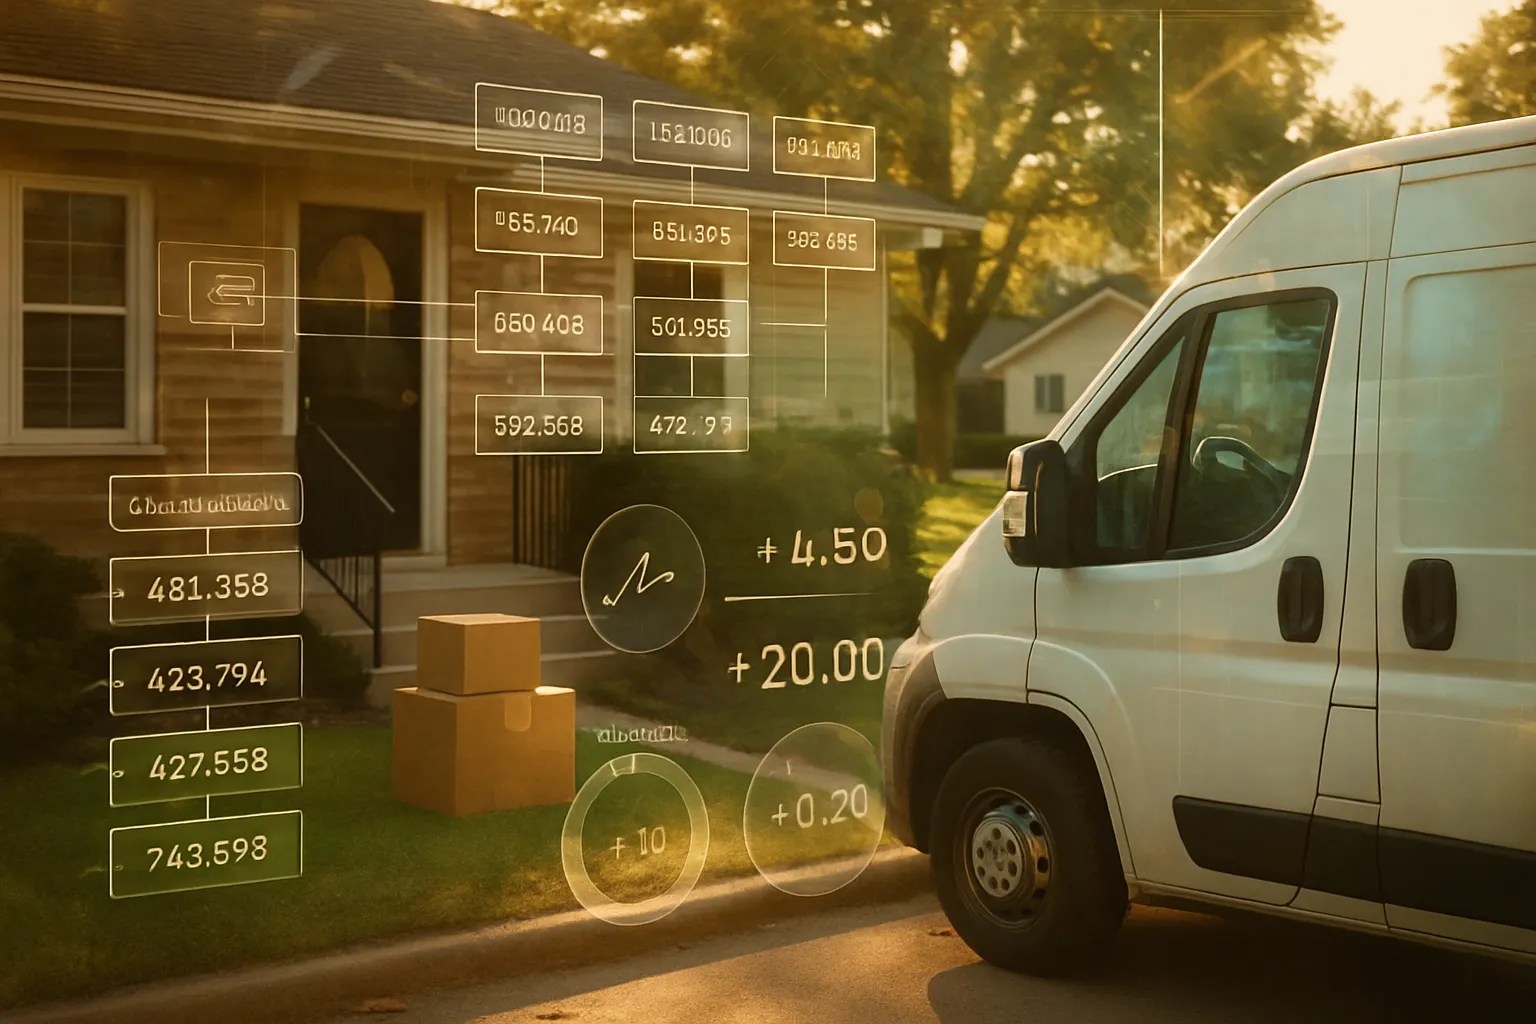
The scale of the returns challenge is staggering even before BNPL's amplifying effect. According to the National Retail Federation, U.S. consumers returned nearly $850 billion in merchandise in 2025, representing a 15.8% return rate across all retail channels. Processing each return costs retailers an estimated $10 to $20 per item in reverse logistics, inspection, restocking, and potential markdowns.
Now layer BNPL's multiplier on top. If BNPL orders return at 2-3x the average rate, and BNPL's share of e-commerce transactions continues to climb — currently accounting for roughly 5-7% of all U.S. online purchases — the incremental reverse logistics burden is substantial. For a mid-size e-commerce retailer processing 50,000 orders monthly with 15% of volume through BNPL, the elevated return rate could mean 2,000 to 3,000 additional returns per month compared to traditional payment baselines.
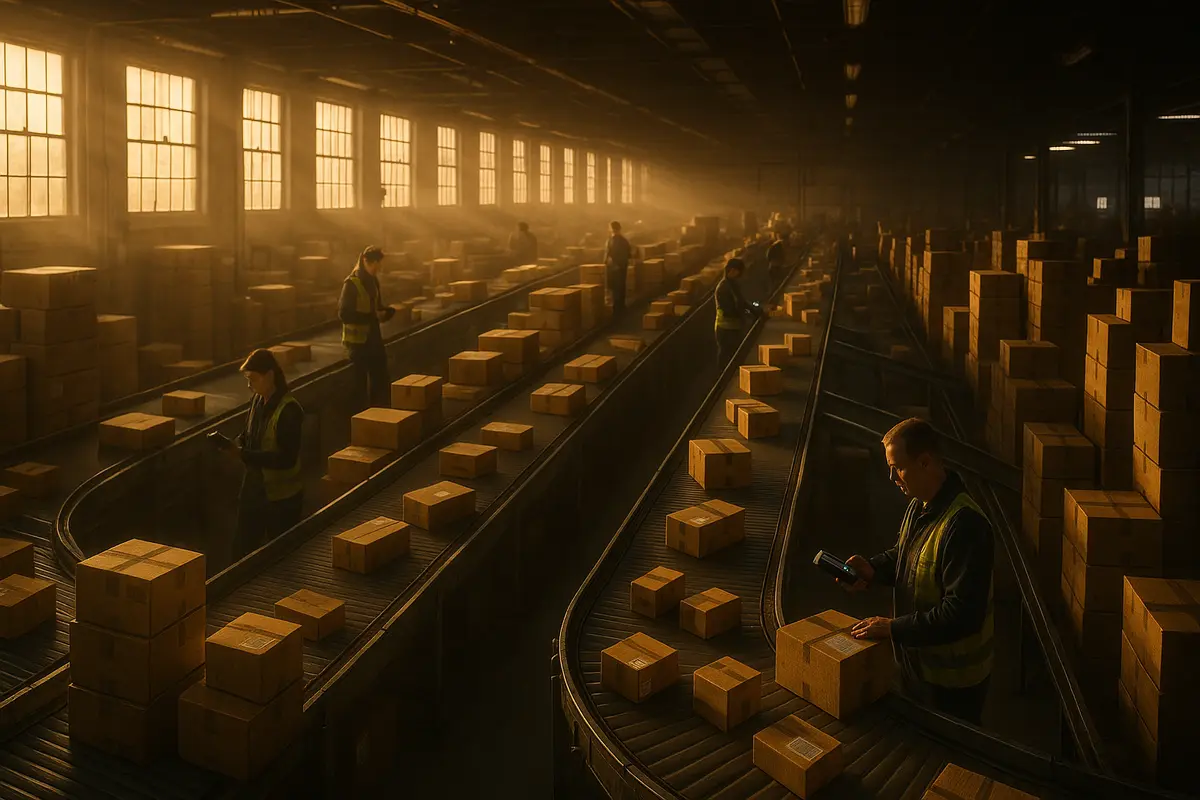
Those returns need trucks. They need receiving docks. They need inspection labor. And they need warehouse space that was planned for forward inventory, not return processing.
Fulfillment Complexity Beyond Returns
The logistics impact of BNPL extends well beyond the return label. BNPL introduces operational complexity at multiple points in the fulfillment chain:
Split-payment order management. BNPL transactions involve a third-party payment intermediary, creating reconciliation complexity when orders are partially returned. A customer who bought three items on a four-payment installment plan and returns one item triggers a cascade of payment adjustments, refund calculations, and inventory updates that must sync across the retailer's OMS, WMS, and the BNPL provider's platform.
Conditional shipping decisions. Some retailers are experimenting with holding shipments until the first BNPL installment clears — introducing a processing delay that conflicts with same-day and next-day delivery expectations. Others ship immediately but must absorb the fraud and default risk when customers receive goods and then dispute BNPL payments.
Higher pick-and-pack volumes per customer. Bracketing behavior means BNPL customers often generate larger, multi-item orders. These orders require more pick paths, larger cartons, and heavier shipments — inflating per-order fulfillment costs even before any returns occur. Post-holiday return spikes can surge 25% to 50% above baseline, and BNPL-driven bracketing intensifies these peaks.
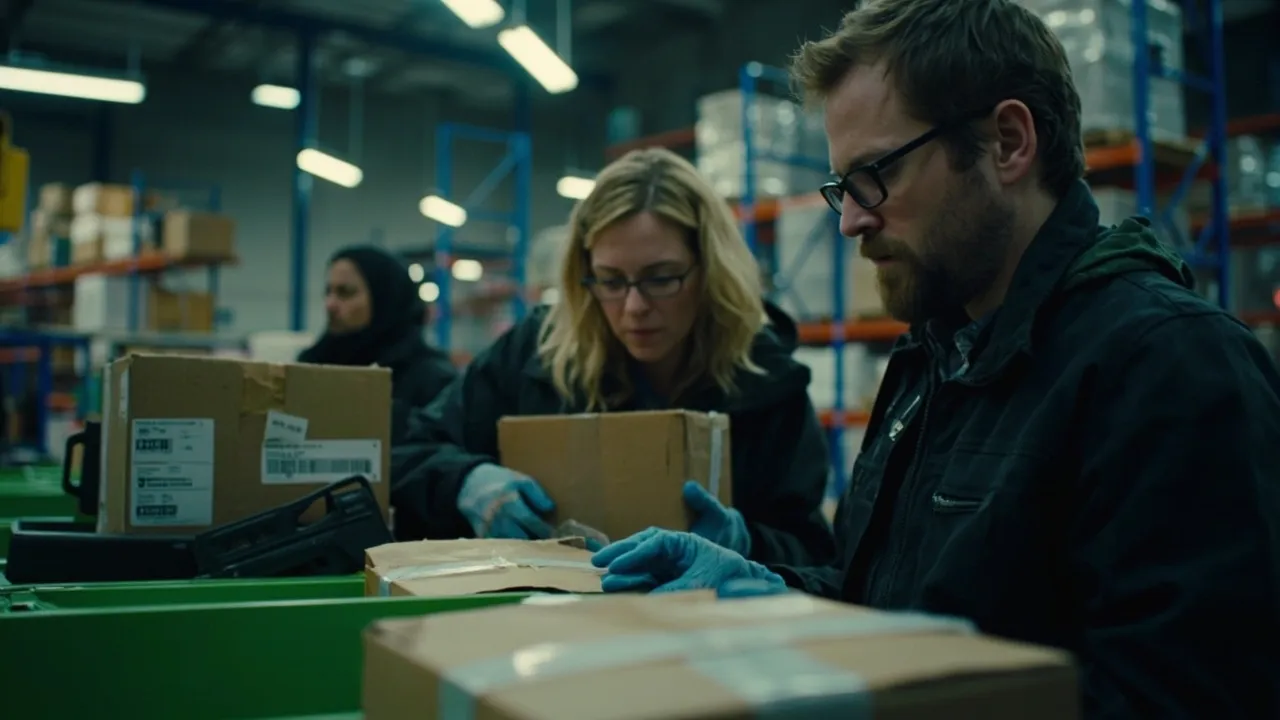
The Warehouse Impact: Reverse Logistics at Scale
For warehouse operators, BNPL-driven returns create a compounding capacity problem. Returns processing typically occupies 10-15% of warehouse floor space in e-commerce facilities. As BNPL volumes grow, that allocation may need to increase to 20% or more — space that comes directly at the expense of forward pick-and-pack operations.
The condition-grading challenge is equally significant. BNPL returns in fashion and electronics often arrive in ambiguous condition — worn once, opened and resealed, or missing original packaging. Each return requires individual assessment: can it go back to primary inventory, should it be routed to secondary markets, or is it destined for liquidation? This grading process is labor-intensive and difficult to automate, creating a throughput bottleneck that scales linearly with return volume.
Speed matters too. BNPL providers typically require refund processing within specific windows to adjust installment schedules. A return sitting in a processing queue for five days doesn't just tie up inventory — it triggers customer complaints and potential disputes with the BNPL platform.
What Smart Retailers Are Doing Differently
Leading retailers aren't waiting for BNPL return volumes to overwhelm their operations. They're adapting with data-driven strategies:
Segmented return forecasting. By tracking return rates by payment method, retailers can build more accurate reverse logistics forecasts. If BNPL orders in a specific category return at 35% versus 12% for credit card orders, warehouse capacity planning and carrier scheduling can account for that differential.
Pre-shipment analytics. Some retailers are using AI to flag high-probability return orders at checkout — particularly multi-item BNPL orders in bracketing-prone categories — and routing them through fulfillment paths optimized for expected returns, such as using returnable packaging or including pre-printed return labels.
Dynamic warehouse zoning. Rather than fixed return processing areas, advanced facilities are implementing flexible zoning that expands return processing capacity during BNPL-heavy promotional periods and contracts it during normal demand.
How CXTMS Helps Retailers Navigate BNPL-Driven Logistics Complexity
The BNPL logistics challenge isn't about stopping returns — it's about predicting them, planning for them, and managing the freight flows they create. CXTMS provides the analytics and visibility layer that retailers need to stay ahead of payment-driven fulfillment complexity.
With CXTMS, retailers can analyze transportation costs segmented by order type and payment method, revealing the true per-order logistics cost of BNPL channels. Real-time reverse logistics tracking ensures returns move through the supply chain efficiently, while predictive demand planning incorporates payment-method return differentials into capacity forecasts.
As BNPL grows from a checkout convenience to a structural feature of retail, the logistics teams that treat it as a supply chain variable — not just a finance function — will be the ones who turn the returns challenge into a competitive advantage.
Ready to get ahead of BNPL-driven fulfillment complexity? Request a CXTMS demo and discover how real-time analytics and reverse logistics visibility can help your team manage the returns patterns reshaping retail supply chains.