99 Drivers Out of Service: Add Inspection Exposure to Every Freight Corridor Plan

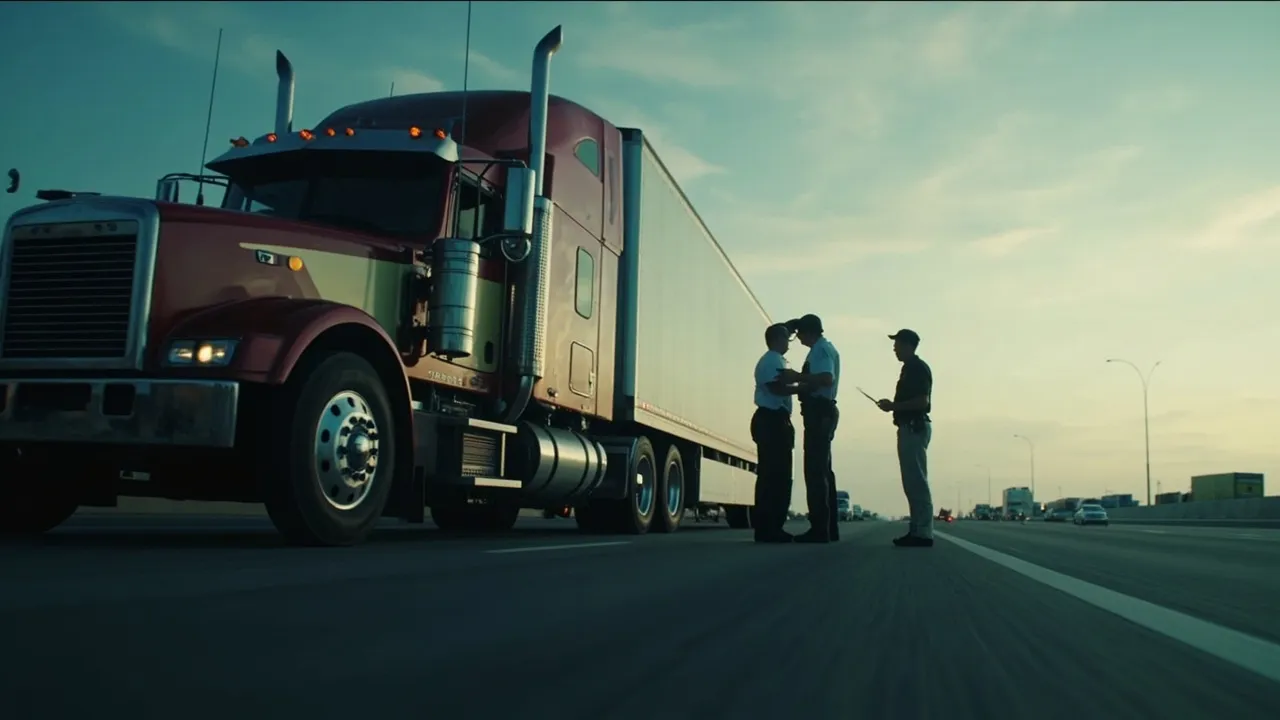
A truck can leave the yard on time, carry a confirmed appointment and still disappear from the operating plan at the next inspection point. Recent enforcement activity across six states shows why roadside compliance belongs in corridor planning—not merely in a carrier's safety file.
FreightWaves reported that recent operations in Arizona, Florida, Pennsylvania, Georgia, Indiana and Texas placed at least 99 commercial drivers out of service. Indiana reported eight additional out-of-service violations but did not specify whether they involved drivers or vehicles, so they were excluded from that total.
For freight planners, the lesson is practical: inspection exposure is a shipment risk with a location, probability, cause and recovery cost. It should be modeled accordingly.
What the enforcement numbers reveal
The incidents were not a single national campaign with uniform conditions. They occurred on distinct freight corridors, including Interstate 40 near Flagstaff, Interstate 4 in Florida and Interstate 74 near the Indiana–Ohio line. That makes the results especially useful for planning: enforcement pressure can concentrate by route and time window.
The Texas operation in Mentone produced the starkest figures. Authorities conducted 351 commercial vehicle inspections, recorded 1,935 violations and placed 167 vehicles plus 34 drivers out of service. That equals 5.5 violations per inspection and a 47.6% vehicle out-of-service rate. Equipment problems accounted for 1,557 violations, while inspectors also found 138 weight, 97 registration, 57 federal driver and 17 hazardous-materials violations.
In Arizona, inspectors conducted 309 inspections and weighed 516 commercial vehicles during a four-day operation on I-40. They documented 1,042 violations, placing 60 vehicles and 59 drivers out of service after identifying 161 out-of-service violations.
These concentrated operations should not be mistaken for a universal failure rate. They were targeted enforcement events, not random samples of every truck on the road. But that distinction strengthens the planning case: certain corridors, commodities, operating profiles and inspection campaigns can create exposure far above a network-wide average.
For broader context, 2025 International Roadcheck results covered 56,178 inspections and sidelined 10,148 vehicles and 3,342 drivers. The reported out-of-service rates were 18.1% for vehicles and 5.9% for drivers. Even an average exposure of that size can break a tightly sequenced delivery plan.
Separate four causes of interruption
A useful risk model should avoid treating every inspection failure as the same event. Planners need four cause categories because each requires a different recovery response.
Driver risk includes hours-of-service, licensing, impairment and driver-fitness issues. A roadworthy tractor and trailer may remain stationary until a qualified replacement driver arrives.
Vehicle risk covers brakes, tires, lights, load securement and other equipment defects. Recovery may require roadside repair, a tractor swap, trailer repair or transloading.
Documentation risk includes registration, permits and shipment paperwork. These exceptions may be resolved digitally, but only if the correct documents and responsible staff can be reached immediately.
Carrier-level risk reflects persistent safety and compliance patterns. A single shipment workaround does not solve it; procurement and operations may need to reduce tender volume or require a corrective-action plan.
This classification matters because “truck delayed at inspection” is not an actionable status. “Driver out of service; replacement ETA 150 minutes” is.
Build an inspection-exposure score
Freight forwarders and shippers can add an inspection-exposure score to each planned movement using three inputs.
First, measure corridor intensity. Track known inspection stations, recurring enforcement campaigns, port and border checks, seasonal safety initiatives and recent activity by route. A lane crossing multiple high-activity zones should carry more schedule buffer than an otherwise similar lane.
Second, assess carrier history at the operational level. Relevant inputs include recent roadside violations, out-of-service events, equipment age and maintenance exceptions. Carrier safety indicators should influence planning before dispatch, not appear only during quarterly procurement reviews.
Third, quantify recovery optionality. Identify substitute drivers, tractors, trailers, repair partners and cross-dock facilities near the route. A higher-probability inspection event may still be manageable when recovery capacity is close. A lower-probability event can be severe on an isolated corridor with no backup equipment.
The resulting score should affect tender selection, departure time, appointment buffer and escalation rules. It should not become a hidden penalty with no operational response.
Trigger recovery from verified events
Waiting for a customer to ask why a truck stopped moving wastes the most valuable recovery minutes. A transportation management workflow should combine inspection status with location, appointment time and shipment priority.
Once an out-of-service event is verified, the plan can automatically:
- classify the cause as driver, vehicle, documentation or carrier-level;
- calculate the remaining appointment margin;
- identify qualified substitute capacity near the truck;
- notify the shipper, consignee and internal owner with a specific recovery estimate;
- preserve the inspection record for carrier performance review.
Human approval should remain in the loop for costly moves such as transloading, substitute-carrier dispatch or appointment renegotiation. Automation is most valuable when it assembles the facts and options quickly enough for a person to make a sound decision.
Measure service outcomes, not inspection alerts
An inspection-risk program succeeds when it protects freight, not when it generates more notifications. Track prevented appointment failures, time from verified out-of-service status to recovery decision, substitute-capacity acceptance, dwell added and customer-notification lead time.
Also compare planned versus actual performance by corridor and carrier. If a supposedly low-risk route repeatedly produces inspection disruption, recalibrate the score. If a carrier consistently resolves documentation issues in minutes, reflect that recovery capability without ignoring the underlying compliance trend.
The 99 sidelined drivers are a reminder that safety enforcement can become a network event one truck at a time. Putting inspection exposure into the corridor plan gives operations teams something better than surprise: time to choose a safer carrier, build a realistic buffer and recover the shipment before service fails.
Ready to connect corridor risk, carrier compliance and shipment recovery in one workflow? Request a CXTMS demo and see how exception-driven transportation planning keeps freight moving.