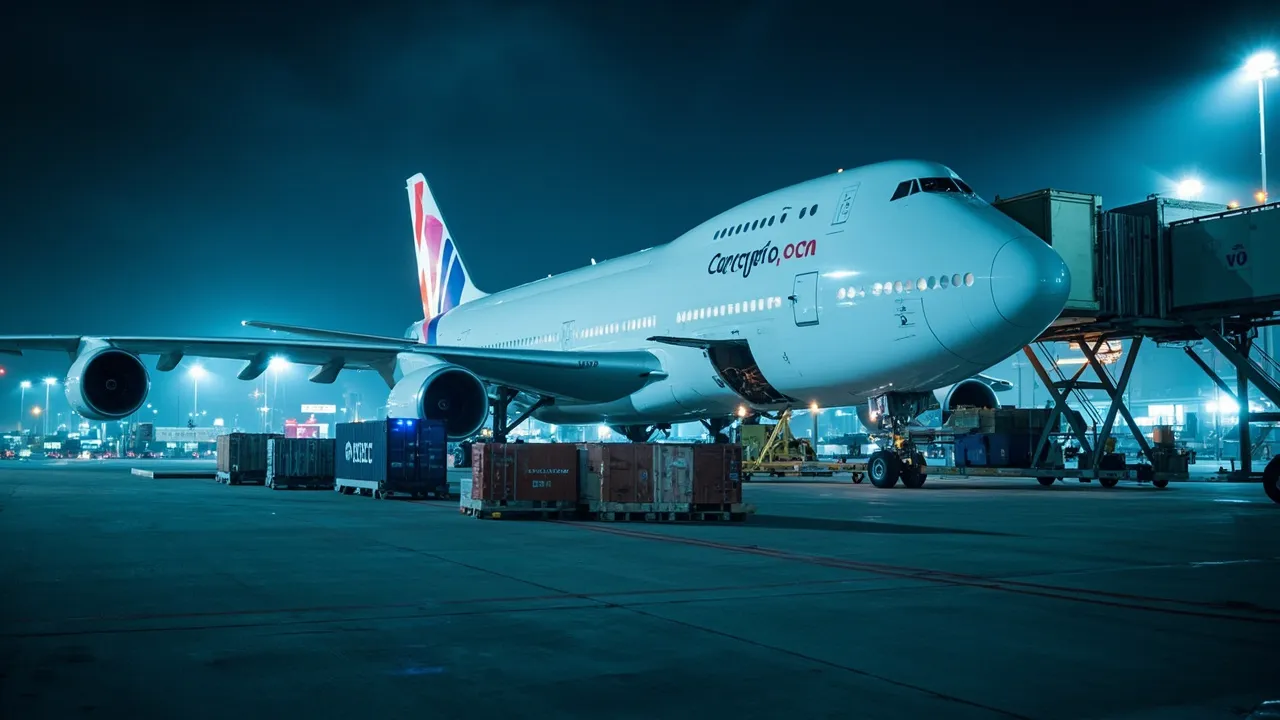
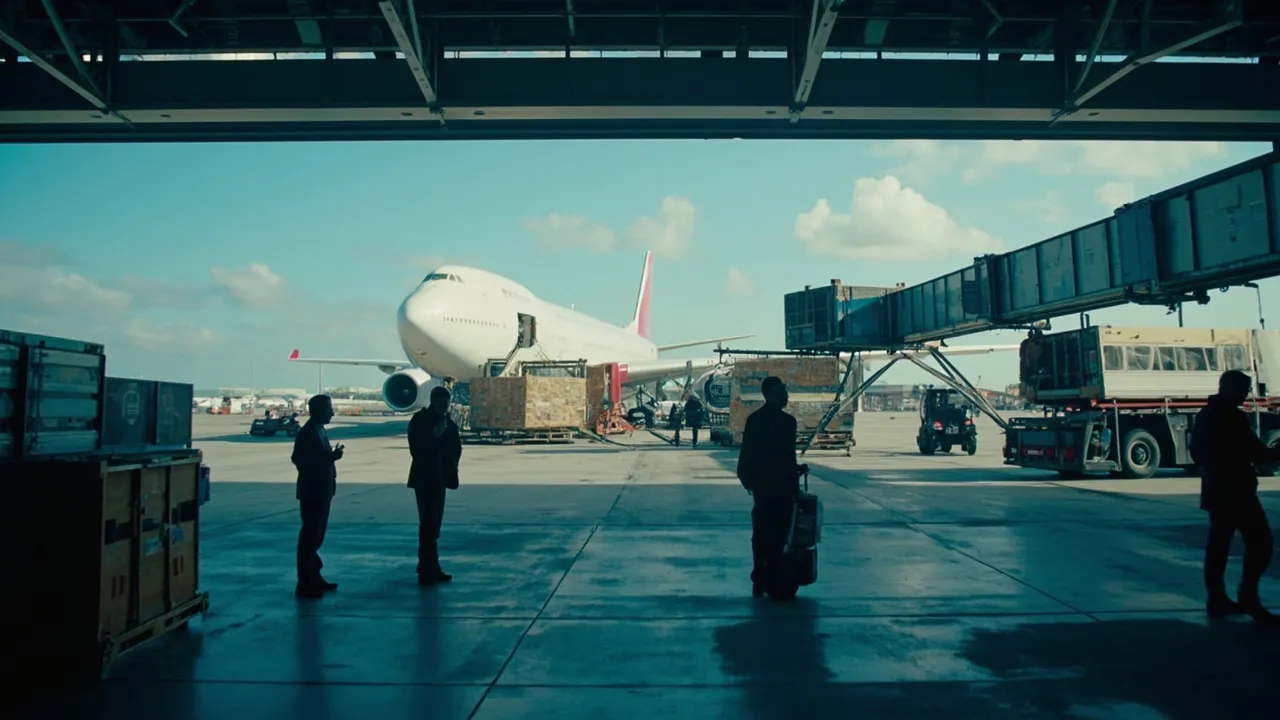
Korean Air Cargo Automation: Building a Dual-Hub Acceptance Test for Incheon and JFK


Airport cargo automation is only valuable when it survives the operating day: late aircraft, uneven ULD arrivals, temperature-sensitive freight, damaged containers, and equipment faults that never occur during a polished demonstration.
Korean Air is making large capital investments in automated container handling and refrigerated storage at Incheon International Airport and New York JFK. FreightWaves reports that a comprehensive upgrade of Cargo Terminal 1 at Incheon is expected to be completed by September. The project creates a useful question for forwarders and shippers: what evidence should prove that two upgraded hubs are ready for live freight?
The answer is not a generic “system available” metric. Incheon and JFK need a shared acceptance framework that tests throughput, handoffs, cold-chain integrity, and fault recovery under realistic peak conditions.
Convert network scale into test demand
Korean Air operates 23 freighters, including seven Boeing 747-8 aircraft and twelve 777 freighters, according to FreightWaves' fleet reporting. That fleet count is not itself a terminal capacity requirement. The acceptance team must translate the schedule into simultaneous workload.
Start with the busiest rolling two-hour window at each hub. For every arriving and departing flight, record planned ULD positions, loose cargo, transfer connections, special-handling codes, truck appointments, and build or breakdown deadlines. Then add stress factors: an early arrival, a late departure, a missed truck slot, and a temporary cold-room surge.
The resulting test volume should be expressed as ULD moves per hour, not annual tonnage. Annual totals disguise the queue that forms when three widebody flights overlap. Acceptance should also distinguish loaded and empty ULDs, because their travel paths, identification checks, and damage risks differ.
Use the same workload model at both hubs, but do not impose identical numeric thresholds. Incheon is a major network hub with dense transfer activity; JFK has different facility geometry, landside constraints, and import-export handoffs. Comparable definitions matter more than artificial symmetry.
Test the entire handoff, not one machine
Automation vendors can demonstrate that a conveyor, transfer vehicle, or storage position moves equipment. An operating test must prove that data and custody move with it.
Select representative ULDs and trace each from aircraft acceptance through identification, weighing or screening, automated transport, storage, build or breakdown, and release. At every transition, compare the physical ULD number, system record, location timestamp, flight assignment, and handling status. A move that finishes physically but leaves a stale system location is a failed move.
Run four workload scenarios:
- Normal peak: the forecast schedule at the 95th-percentile planned volume.
- Compressed peak: one arrival 30 minutes early and another 30 minutes late, forcing overlap.
- Exception peak: include unreadable tags, overweight ULDs, manual inspections, and damage holds.
- Recovery peak: disable one critical automated component and require controlled fallback without losing custody records.
Measure end-to-end dwell from terminal acceptance to the next operational milestone. Report the median, 90th percentile, and worst case. An average can look healthy while a small but commercially important group of transfer ULDs misses connection cutoffs.
Make cold-chain acceptance evidence-based
Refrigerated rooms deserve a separate protocol. The market context is substantial: Mordor Intelligence estimates the food cold-chain market at $78.55 billion in 2026 and projects 11.34% annual growth through 2031. For pharmaceuticals, perishables, and other sensitive cargo, room capacity alone does not establish service quality.
Place calibrated sensors in representative pallet and container positions, including near doors and at likely warm spots. Test each supported temperature band with the room at normal occupancy and at the planned maximum. Track temperature continuously while freight waits for acceptance, moves between zones, undergoes inspection, and transfers to or from the ramp.
The scorecard should record excursion count, excursion duration, maximum deviation, door-open time, alarm latency, acknowledgement time, and time to corrective action. It should also reconcile sensor identity to shipment and ULD records. A temperature alarm without a clear list of affected shipments creates an investigation, not a control.
Use a four-part acceptance scorecard
A useful scorecard should be small enough to manage during live operations:
| Control area | Primary measure | Acceptance evidence |
|---|---|---|
| ULD flow | 90th-percentile dwell and connection success | Timestamped moves by ULD and milestone |
| Asset care | Damage events per 1,000 moves | Before-and-after inspection records with photos |
| Cold chain | Excursions by band, duration, and shipment | Calibrated sensor logs linked to cargo records |
| Resilience | Detection and recovery time by fault | Alarm, decision, fallback, reconciliation, and restart log |
Set thresholds before the test begins. Otherwise, teams can reinterpret poor results as acceptable after seeing them. Every failed threshold needs an owner, corrective action, retest date, and rule governing whether limited production may continue.
Fault tests should include loss of a scanner, blocked conveyor segment, vehicle outage, network interruption, power transition, and cold-room alarm. Recovery is complete only when physical inventory and system inventory reconcile. Restarting a machine while two ULDs remain in unknown locations is not recovery.
Put terminal readiness into routing decisions
Forwarders should use acceptance results as routing data, not file them as engineering documentation. For each gateway, maintain a readiness profile covering peak dwell reliability, transfer performance, cold-room capacity by temperature band, exception-processing time, and demonstrated fallback capability.
Route scoring can then reflect shipment needs. A general-cargo movement may prioritize capacity and connection time. A pharmaceutical shipment should apply stronger penalties for warm-zone exposure, limited refrigerated contingency space, or slow alarm response. A tight transfer should favor the hub with proven 90th-percentile handoff performance rather than the lowest theoretical transit time.
Market conditions make this discipline more important, not less. Supply Chain Dive reports that softening rates and limited peak-season activity point to a weaker second half of 2026. When capacity is available, forwarders have room to choose routes based on handling quality. When demand returns, a tested readiness model prevents price and schedule from crowding out operational risk.
Korean Air's dual-hub investment can improve speed, consistency, and cold-chain control. The proof should be a repeatable operating record: ULDs located correctly, connections protected, temperatures maintained, damage minimized, and faults recovered without losing custody.
Ready to connect terminal performance, shipment exceptions, and routing decisions in one workflow? Request a CXTMS demo and see how measurable handling data can improve airfreight execution.