Ryder Adds Six East Coast Locations: How Shippers Should Audit an Expanded Fleet Service Network

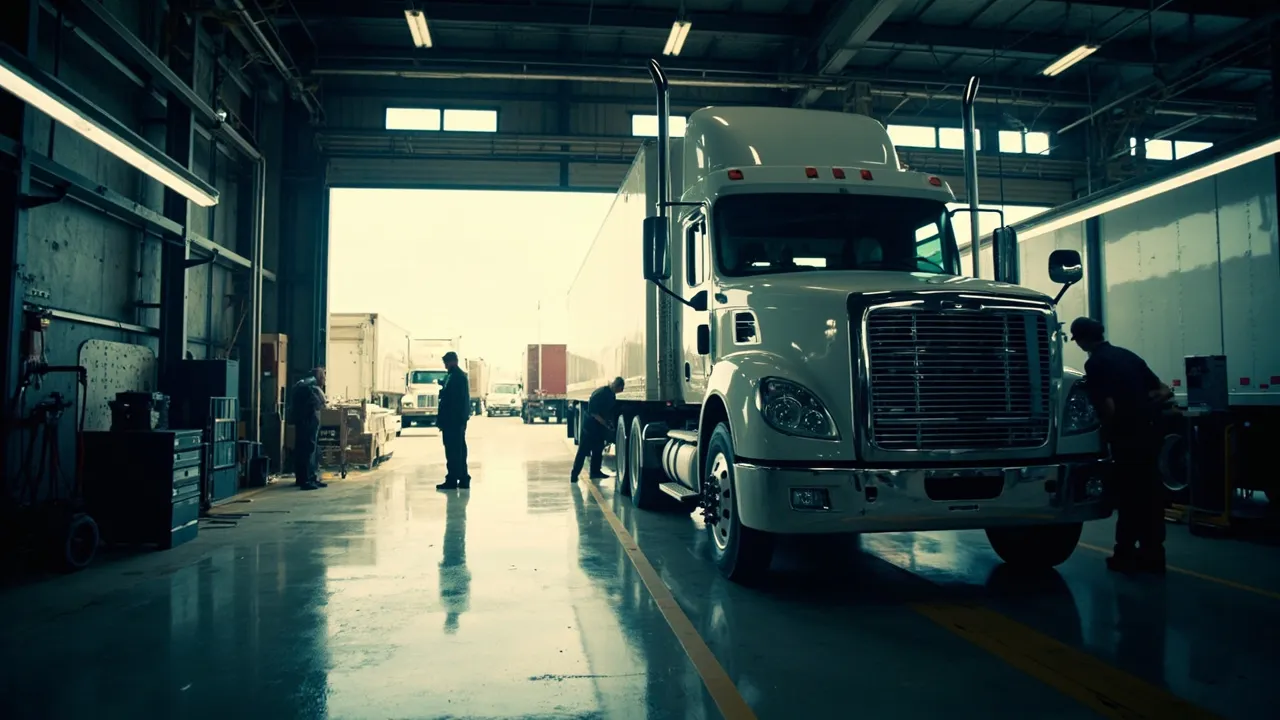
Ryder System's acquisition of Efficiency Enterprises expands a familiar fleet-services brand across a strategically useful stretch of the East Coast. But an extra pin on a service map does not automatically produce more uptime. Fleet customers should treat the first 90 days after integration as a measured operational test—not assume that the acquired capacity is immediately interchangeable with the existing network.
Logistics Management reports that the November 1 transaction adds six locations, about 50 technicians, and roughly 1,200 fleet units to Ryder's rental, leasing, and maintenance business. The sites are in Orlando, Tampa, and Fort Myers, Florida; Astoria, New York; Baltimore, Maryland; and Middletown, Delaware. Ryder expects the acquired operation to contribute approximately $50 million in gross revenue to Fleet Management Solutions in 2027.
That footprint looks compelling. It reaches New York City delivery operations, Baltimore's port and manufacturing base, and three fast-moving Florida markets. The practical question for a shipper, however, is whether those sites reduce the time between a defect appearing and an asset returning to service.
Audit the network as four operating promises
An expanded network should improve four outcomes: roadside response, maintenance access, parts availability, and substitute-equipment coverage. Each must be tested separately.
Roadside response. Measure acknowledgment time, technician dispatch time, arrival time, and total roadside dwell by location and incident type. A nearby facility is useful only if it has the hours, mobile-service coverage, and technician availability to respond when breakdowns occur. Separate provider-controlled delay from weather, towing, and customer-authorization delay.
Maintenance slots. Track the elapsed time from a preventive-maintenance request to the first usable appointment, plus bay-entry-to-release time. Confirm whether the acquired locations accept all vehicle classes in the customer's fleet and whether evening or weekend slots are genuinely available. A site can increase geographic coverage while adding little usable capacity for a particular specification.
Parts access. Record first-time parts fill rate, back-order frequency, emergency transfer time, and the percentage of jobs paused awaiting components. Ask whether the six sites share inventory visibility with the broader Ryder network and whether common parts can be transferred overnight. Technician capacity cannot offset a stalled parts pipeline.
Substitute equipment. Measure fulfillment rate for replacement tractors, trailers, and material-handling assets, along with time to delivery and specification match. Efficiency Enterprises brings more than 900 power and trailer units and over 200 material-handling units, according to Logistics Management, but customers need to know how many are actually rentable, where they sit, and whether they meet operational requirements.
Why small delays deserve executive attention
Maintenance is no longer a minor line item. FreightWaves reports that carriers' average marginal cost reached $2.336 per mile in 2025, while maintenance and repair costs rose 8.6% year over year and 45% from 2019. The same report cites 8.7 days of unplanned downtime per vehicle annually, costing between $448 and $760 per day in lost productivity. Reactive repairs can cost three to nine times as much as planned preventive work.
Those figures make the audit economically meaningful. For a 100-vehicle fleet, cutting only one unplanned downtime day per asset could protect $44,800 to $76,000 in annual productivity. That is an illustrative calculation, not a promised result, but it shows why appointment availability and parts fill rates matter more than the acquisition headline.
Normalize the data before comparing performance
Acquisitions often bring different work-order labels, service codes, labor categories, asset identifiers, and definitions of completion. Without normalization, a customer may compare unlike records and reach the wrong conclusion.
Create a crosswalk before establishing the baseline. Map legacy and Ryder service codes to common categories such as preventive maintenance, roadside repair, tires, brakes, powertrain, body, trailer, and material handling. Use one asset master keyed to VIN or another durable identifier, not a local unit number alone. Standardize timestamps for request received, authorization, bay entry, work started, work completed, and asset released.
Also preserve the original source system and location on every record. That enables the customer to isolate integration effects without losing an enterprise-wide view. Require consistent reason codes for repeat repair, parts delay, no technician, customer hold, and substitute unavailable. Free-text notes are valuable context, but they are a poor foundation for a scorecard.
Build a 90-day post-integration scorecard
Start with a pre-acquisition baseline covering at least the prior quarter, then review results weekly and formally at days 30, 60, and 90. The scorecard should include:
- Roadside acknowledgment, dispatch, arrival, and return-to-service time
- Days to the next usable preventive-maintenance appointment
- Planned maintenance completed on schedule
- First-time parts fill rate and jobs delayed for parts
- First-time fix rate and repeat repair within 30 days
- Substitute-equipment request fulfillment and specification match
- Downtime hours and maintenance cost per asset and per mile
- Invoice accuracy, work-order coding completeness, and disputed charges
Segment every measure by site, asset class, service type, and week. Network averages can conceal a weak location or a strong site burdened with the wrong equipment mix. Use median and 90th-percentile cycle time alongside the average so a small number of severe delays remain visible.
Set improvement targets against the customer's baseline and contract rather than arbitrary industry numbers. Assign an owner and corrective action to every missed threshold. At day 90, the evidence should support one of three decisions: expand volume through the new sites, hold allocation while defects are corrected, or route selected work elsewhere.
Ryder's expansion creates real potential: denser coverage, more technicians, more assets, and access to important freight markets. Shippers will capture that value only by translating network growth into measurable service outcomes.
Ready to connect fleet service events, shipment plans, and performance data in one operating view? Request a CXTMS demo and see how exception-driven transportation management keeps operations moving.