Physical AI in Warehouses Needs a Human-Intervention Cost Metric

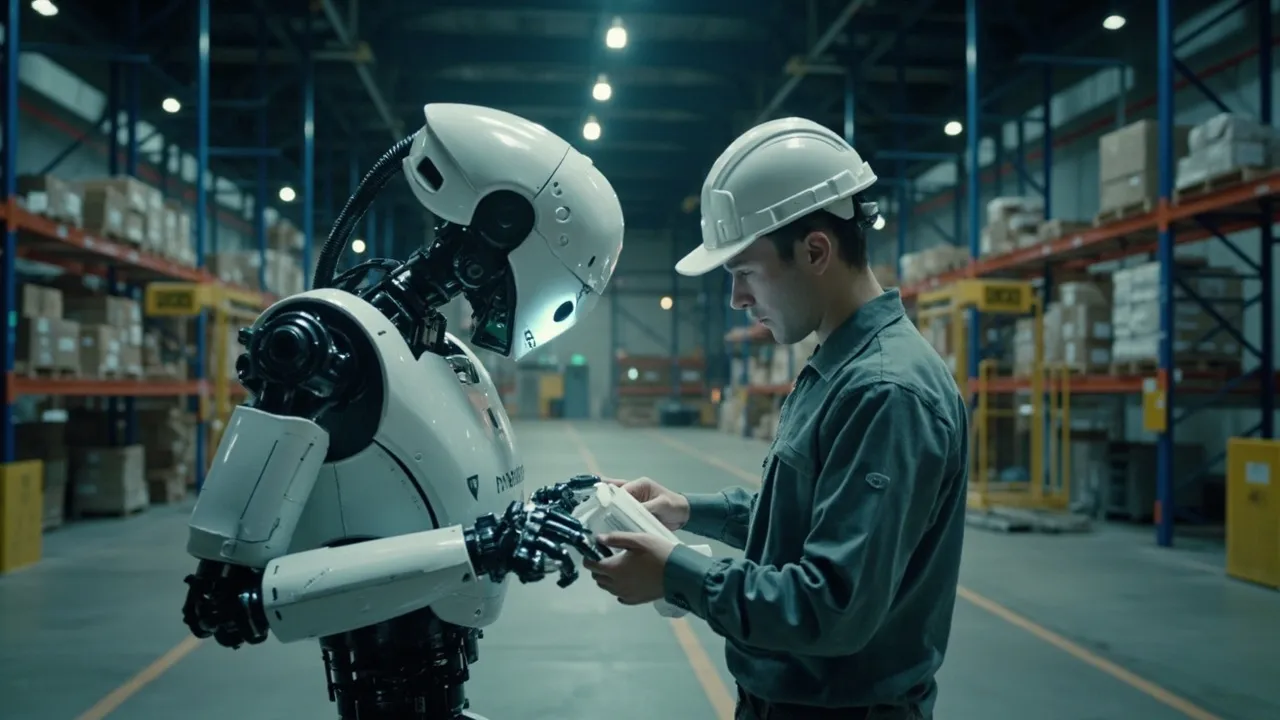
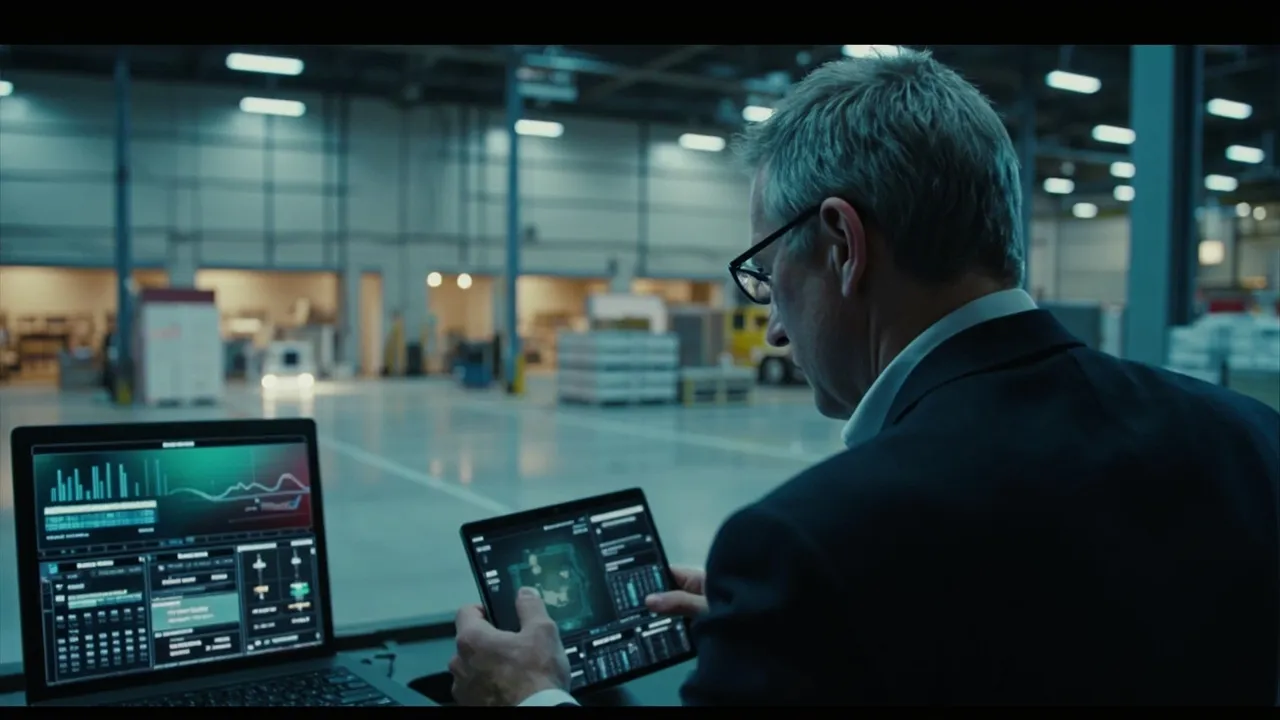
Physical AI promises warehouse systems that perceive changing conditions, make decisions, and act without every movement being programmed in advance. That is a meaningful step beyond fixed automation. But a robot can post an impressive picks-per-hour number while supervisors clear blocked aisles, technicians reset faults, and downstream teams absorb the work it could not complete.
Those human touches are not edge details. They determine the labor requirement, resilience, and service value of the system. Warehouse leaders therefore need a metric that conventional throughput dashboards often omit: human-intervention cost per 1,000 autonomous tasks.
Autonomy is not the absence of people
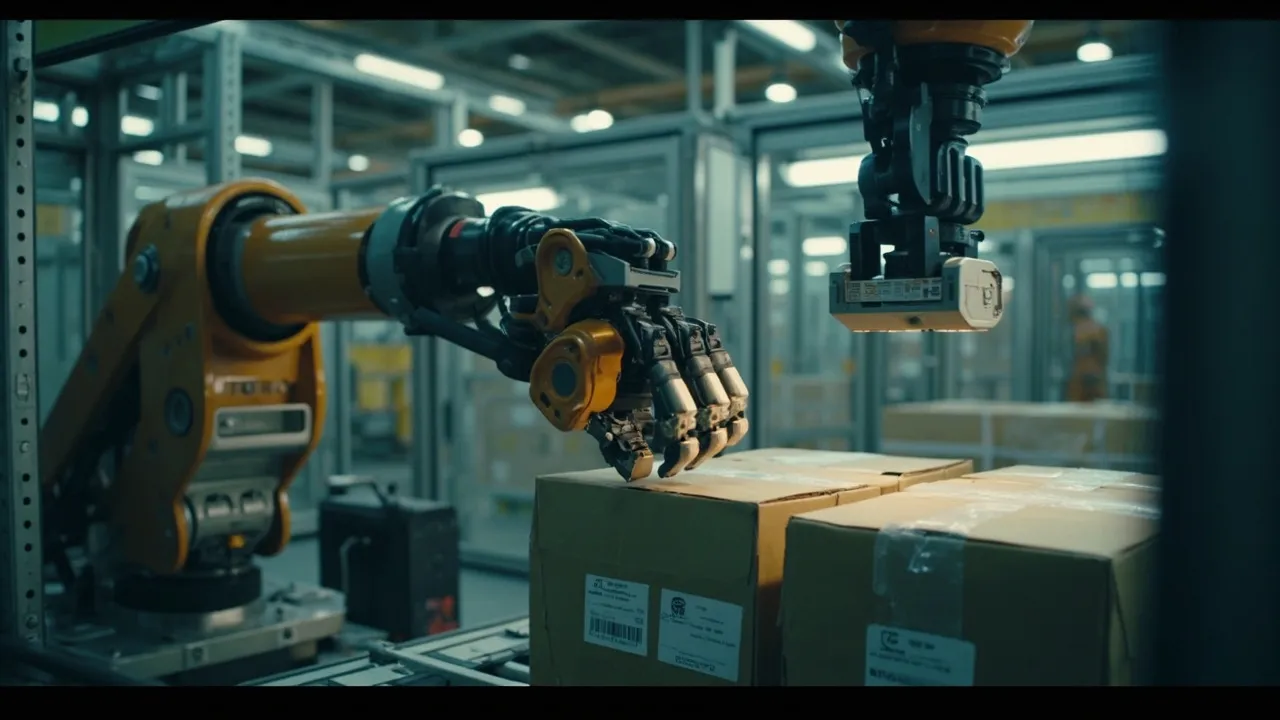
SupplyChainBrain describes physical AI as enabling autonomous equipment to adjust to obstacles and changing workloads rather than depend entirely on predetermined routes. That adaptability can make automation useful in less controlled environments. It does not mean exceptions disappear.
A tote may be damaged, a barcode unreadable, an aisle unexpectedly obstructed, or an item presented in an unfamiliar orientation. A task can also be technically completed yet create a downstream problem: inventory placed in the wrong buffer, a late wave, or freight staged after its trailer cutoff.
Investment is accelerating despite those operational questions. Modern Materials Handling reports that the automated material-handling equipment market is expected to reach $61.14 billion by 2030, growing at a 7.5% compound annual rate. As spending rises, buyers need evidence that automation reduces total effort instead of moving labor into harder-to-see recovery work.
Build the intervention ledger
Start by recording every event in which an autonomous workflow needs a person to continue, correct, or verify it. Each entry should capture the robot or subsystem, task type, SKU and handling attributes, exception class, location, time detected, responder role, hands-on minutes, recovery time, and final disposition.
Then calculate four connected measures:
- Interventions per 1,000 tasks: the frequency with which autonomy needs help;
- Intervention minutes per 1,000 tasks: the direct human effort consumed, including diagnosis and reset work;
- Mean time to recovery: the elapsed time from failure detection until the system resumes normal flow; and
- Queue spillover: tasks, units, or orders delayed elsewhere while the affected process is unavailable.
Frequency alone can mislead. Ten barcode confirmations lasting 30 seconds each are different from one navigation failure that stops an aisle for 40 minutes. Conversely, a fast reset may still be costly when the same failure happens hundreds of times per shift. Measuring both occurrence and duration exposes those differences.
A basic labor calculation is straightforward:
Intervention labor cost per 1,000 tasks = intervention minutes ÷ 60 × loaded hourly labor rate.
The complete cost should add lost automated capacity, technician callout charges, expedited handling, overtime, missed carrier cutoffs, and any service penalties. This converts a reliability problem into a comparable operating figure.
Test the hard operating conditions
A single blended average hides where autonomy is fragile. Segment the ledger by the conditions that change warehouse work.
First, compare SKU characteristics: rigid cartons versus deformable packaging, standard cases versus eaches, familiar products versus new introductions, and normal labels versus damaged or reflective ones. Next, separate steady-state volume from peak waves. Congestion may increase path conflicts and make a two-minute stoppage more consequential because queues form faster.
Finally, analyze exception classes individually. Perception errors, grasp failures, depleted batteries, communication losses, inventory discrepancies, safety stops, and upstream starvation require different remedies. A software-model update will not solve a charging bottleneck, and adding technicians will not correct poor master data.
Report the median and the 90th or 95th percentile recovery time, not only the mean. A system that usually recovers in two minutes but occasionally remains down for an hour presents a different service risk than one with consistent three-minute recoveries.
Connect the robot event to the dock door
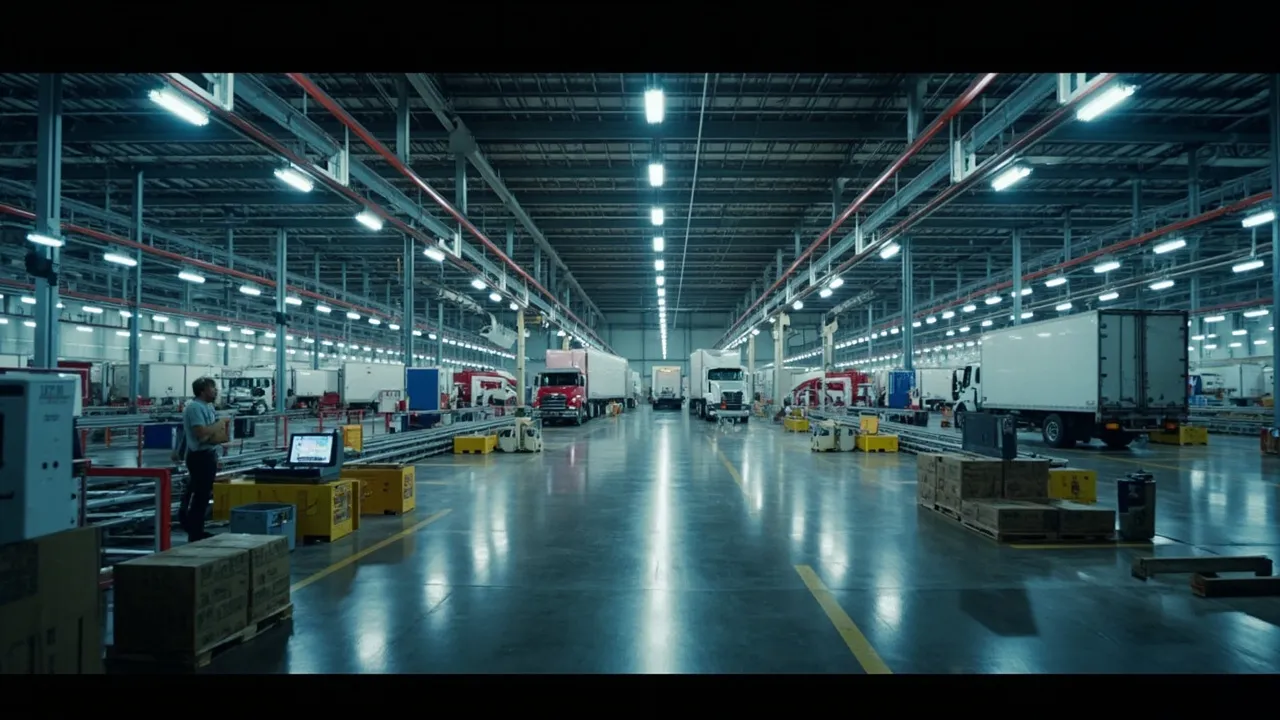
Warehouse automation should ultimately improve fulfillment and transportation performance. That link is often lost because robot data ends at the subsystem dashboard while shipment data begins in a WMS or TMS.
Join autonomous task events with order waves, staging completion, dock appointments, trailer close times, and actual departure events. Then ask whether interventions changed:
- order cycle time and promised ship time attainment;
- staging completion before the carrier cutoff;
- dock-door dwell and trailer loading duration;
- on-time departure; and
- premium freight or rescheduling requirements.
This prevents local optimization. A robot fleet can increase completed moves per hour yet reduce departure reliability if its exceptions cluster near wave completion or if failed tasks need scarce supervisors during the shipping cutoff. The operating value is not the robot's maximum speed; it is the dependable flow delivered to the next constraint.
Put intervention cost into purchasing and governance
Pilot scorecards should specify the task mix and operating conditions before the trial begins. Require vendors and internal teams to report autonomous completion, intervention frequency, human minutes, recovery distribution, and service impact under comparable volume and SKU complexity.
Set improvement triggers as well. Repeated low-complexity exceptions can feed model training or process redesign. High-impact failures need escalation thresholds and named owners. If human-intervention cost rises above the approved level for two review periods, the site should pause expansion until the root cause is corrected.
This metric also improves automation portfolio decisions. Two systems with similar throughput may have very different support requirements. The one with the higher purchase price can be cheaper if it needs fewer recoveries, creates less queue spillover, and protects departures during peak periods.
Measure physical AI across warehouse and transport with CXTMS
CXTMS connects order, shipment, appointment, and departure events so logistics teams can see whether warehouse interventions affect transportation execution. Operators can relate exception timing to dock dwell, cutoff misses, carrier rescheduling, and on-time performance rather than judging automation in isolation.
Physical AI deserves a business case based on dependable service, not a polished throughput demonstration. Request a CXTMS demo to connect warehouse events with shipment outcomes and build a more complete automation performance scorecard.