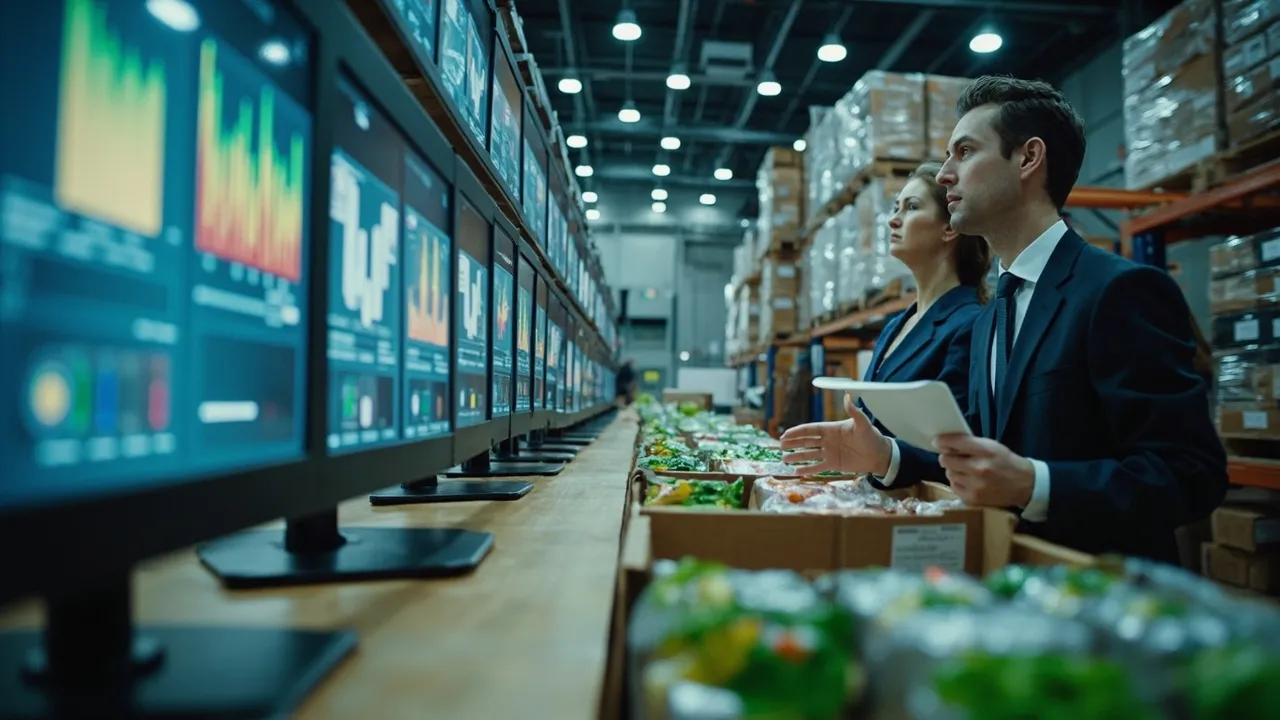
Ocean Spray's New Supply Chain Chief: The First 90-Day Operating Baseline


A new chief supply chain officer inherits more than plants, warehouses, and carrier contracts. The role also inherits competing definitions of demand, service, inventory health, and accountability. In a food network, those disagreements can become waste, missed customer orders, or rushed transportation before a leader has time to launch a formal transformation.
That is why the first 90 days should establish an operating baseline, not produce a long list of projects. The immediate job is to make performance visible, document who decides what, and identify a few repeatable exceptions that deserve action.
The Appointment and Its Operational Scope
Ocean Spray named Brad Hartzell chief supply chain officer in September 2026. According to Supply Chain Dive, Hartzell brings 25 years of industry experience and will oversee supply chain and operations capabilities for the agricultural cooperative behind cranberry juices, sauces, and Craisins dried fruit. He succeeds Earl Larson, who is retiring after nearly 22 years with the company.
The transition is part of a broader leadership reset. Ocean Spray also appointed a chief strategy and transformation officer, while Abigail Buckwalter became president and CEO only months earlier. That creates opportunity, but it also raises a practical boundary question: which decisions belong to daily supply chain execution, and which belong to enterprise transformation?
The answer should be made explicit early. A cooperative food network connects grower supply, processing and packaging, temperature-sensitive storage, transportation, and retailer service. A change in one area can push cost or risk into another. The new leader needs a shared operating picture before approving technology, footprint, or inventory-policy changes.
Establish Five Measures Before Setting Targets
The baseline should start with five measures calculated consistently by product, site, customer, and week.
- Forecast bias. Accuracy shows the size of error; bias shows its direction. Persistent over-forecasting creates aging inventory and waste, while under-forecasting creates expedites and lost sales. Measure actual demand minus forecast, retain both unit and percentage views, and separate promotions from base demand.
- Plant schedule attainment. Compare completed production with the frozen schedule by line and SKU. Record why orders moved: material shortage, labor, downtime, quality hold, or planning change. An enterprise average can hide one constrained line repeatedly destabilizing the network.
- Inventory age. Show finished goods by remaining shelf-life bands, not only inventory turns. Connect every aging lot to its location, disposition, demand outlook, and financial exposure. In food logistics, total inventory can appear healthy while specific lots approach a sell-by or customer-acceptance threshold.
- Cold-storage dwell. Measure elapsed time from production release to warehouse departure, plus time spent in holds and staging. Segment normal dwell from quality, appointment, carrier, and allocation delays so the team fixes causes rather than merely moving stock.
- Customer fill rate. Use the customer's requested quantity and date as the denominator. Report both case fill and order-line fill, then distinguish supply failure from ordering, allocation, or delivery-window issues.
These measures must reconcile. A site should not report strong attainment while the customer sees poor fill rate because production made the wrong mix. Likewise, low inventory can look efficient while aged stock and shortages coexist.
The stakes are measurable. Food Logistics reported that Goya Foods improved store-delivery performance from 94% to 99% while reducing inventory 20% over five years after deploying integrated demand-planning, fulfillment, and order-optimization capabilities. The lesson is not to copy its software roadmap; it is that service and inventory must be measured together.
Document Decision Rights Across the Network
A baseline without ownership becomes another dashboard. For each recurring decision, name one accountable role, the required inputs, the decision deadline, and the escalation path.
Grower and procurement teams should own committed raw-material supply and constraint signals. Demand planning should own the consensus forecast and explain overrides. Manufacturing should own feasible schedules and production recovery. Warehousing should own lot status, release readiness, and dwell exceptions. Transportation should own capacity coverage, pickup performance, and recovery choices. Commercial teams should approve customer allocation priorities when supply cannot satisfy every order.
The chief supply chain officer should own cross-functional tradeoffs—not every transaction. A useful decision log records the constraint, alternatives, service and cost impact, decision maker, time, and planned review. This prevents the same debate from restarting each week and exposes policies that conflict across functions.
Shared demand matters especially in perishables. SupplyChainBrain notes that a plus-or-minus 5% change in consumer demand can translate into upstream swings as large as 40% when partners create disconnected forecasts. The same source describes a creamery that reduced forecasting work from two hours to 10 minutes weekly and cut overproduction 40% after connecting relevant data. Those results show why consistent inputs and ownership should precede a large transformation program.
A Practical 30/60/90-Day Sequence
Days 1-30: listen and reconcile. Visit the operating nodes, trace several customer orders from forecast through delivery, and compare local metric definitions. Publish a first baseline with data-quality flags rather than waiting for perfect information. Identify the ten largest service, waste, and expedite exceptions and assign owners.
Days 31-60: create operating cadence. Establish a weekly control meeting centered on exceptions, decisions, and due dates. Freeze definitions for the five baseline measures. Introduce a decision-rights matrix and a common reason-code set across planning, production, warehousing, and transportation. Select two or three bottlenecks for controlled improvement work.
Days 61-90: prove repeatability. Confirm that the same data produces the same answer across functions. Measure whether selected exceptions are shrinking, document the economics, and recommend the next-quarter priorities. Only then should the leadership team approve major system, network, or automation initiatives.
Visibility Before Transformation
The strongest first-90-day result is not a dramatic reorganization. It is a trusted operating baseline that links demand, production, inventory, warehouse dwell, transportation, and customer service. With clear decision rights and a disciplined exception cadence, a new supply chain chief can distinguish structural constraints from inconsistent data—and invest with evidence.
Ready to connect planning, inventory, transportation, and service exceptions in one operating view? Request a CXTMS demo and build a baseline your team can act on.