Lear’s Automated Factory Blueprint: Prove the Global Rollout With Replicable Operating Metrics

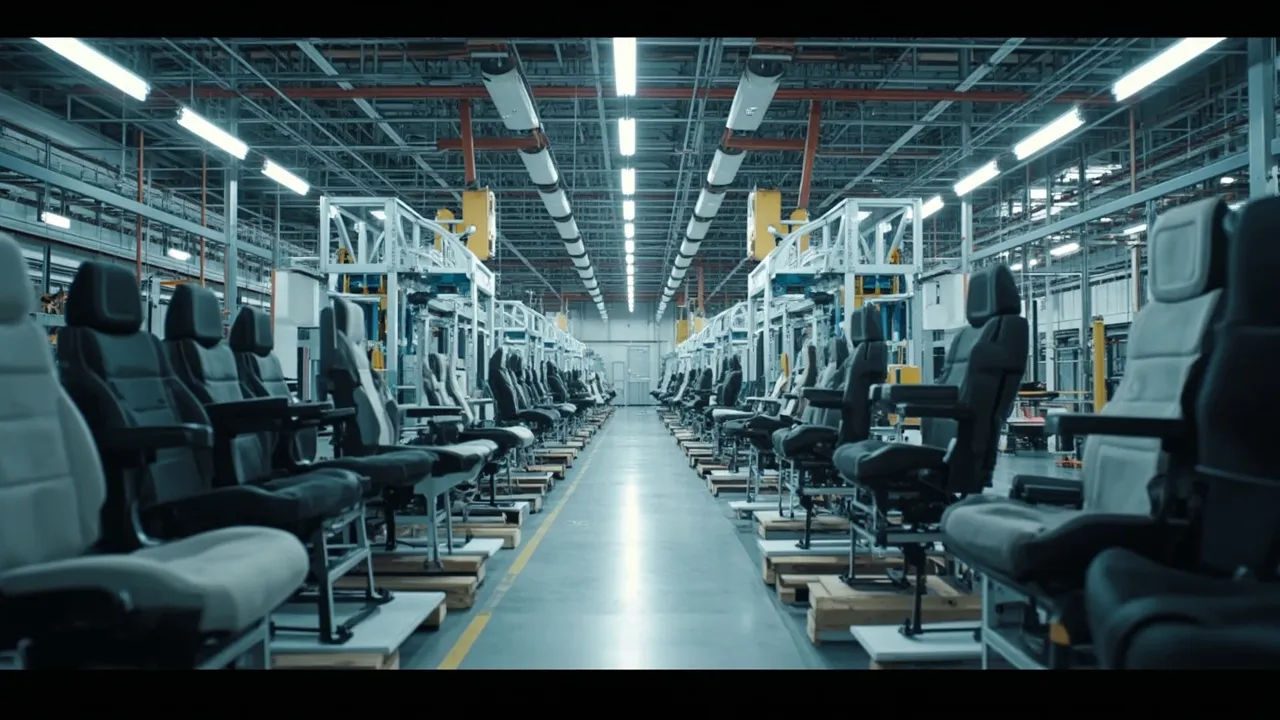
An automated factory becomes a blueprint only when another plant can reproduce its results. A polished launch, advanced robotics, and an impressive automated storage and retrieval system may prove that technology works at one site. They do not prove that the same investment will improve performance across plants with different products, labor markets, supplier networks, and production volumes.
That distinction matters for Lear. Supply Chain Dive reports that the automotive supplier plans to bring a highly automated Michigan facility online next year. The factory is expected to include two separate automated storage and retrieval systems, or AS/RS, and Lear intends to use the site as a blueprint for its global network.
The opportunity is substantial. The hard part is converting a site-specific success into a repeatable operating system.
Separate the technology from the operating conditions
Before Lear copies equipment, it should identify exactly what created each improvement. A throughput gain may come from faster material movement, but it may also reflect a favorable product mix, a new building layout, lower launch volume, extra engineering support, or suppliers located close to the plant. Those conditions may not exist elsewhere.
Every claimed benefit should therefore have a baseline, a post-launch result, and a list of dependencies. If an AS/RS reduces line-side shortages, the analysis should show whether the result depended on standardized containers, accurate advance shipping notices, disciplined scanning, or a stable production sequence. A receiving plant that lacks those foundations will not inherit the benefit merely by purchasing similar machinery.
This is especially important in automotive manufacturing, where variation is structural. Seat systems and electrical components differ by customer platform, configuration, sequence requirements, and plant geography. Automation designed around predictable, high-volume units may struggle in a lower-volume factory with more frequent model changes.
Use five comparable metrics
A global rollout scorecard should use definitions that remain consistent across sites. Five measures provide a practical starting point.
1. Throughput per scheduled hour. Count completed conforming units, not gross machine cycles. Report the result by product family and shift, then compare it with the pre-automation baseline. This prevents a favorable mix from masquerading as a technology gain.
2. Changeover performance. Measure the elapsed time from the last good unit of one run to the first good unit at the target rate of the next. Average changeover time alone is insufficient; the 90th percentile shows whether uncommon configurations destabilize the process.
3. Inventory and location accuracy. Track the percentage of units whose system quantity, identity, status, and physical location all match. MHI identifies inventory accuracy as a key warehouse measure because system data must correspond to what is actually on the shelf. For an AS/RS, accuracy should also include retrieval exceptions and manual interventions.
4. Downtime and recovery. Record planned and unplanned downtime separately, along with mean time between failures and mean time to restore operation. A system that runs efficiently until a fault occurs can still create unacceptable production risk if specialized technicians or parts take hours to arrive.
5. Inbound synchronization. Measure supplier arrivals within the required window, receiving-to-availability time, shortages at point of use, and premium freight triggered by material risk. Factory automation cannot deliver its promised output when inbound transportation remains disconnected from the production sequence.
The measures reinforce one another. Higher machine speed means little if replenishment cannot keep pace. Lower labor content is not a win if recovery time creates missed customer releases. Inventory accuracy must improve enough to support automated decisions without constant human verification.
Set a credible performance range
Leaders should resist turning an exceptional pilot result into the default global business case. Deloitte's 2025 Smart Manufacturing and Operations Survey cites one production-control deployment that increased throughput by 10% to 15% and an assembly constraint-resolution command center that reduced mean time to resolution by 26%. Those examples demonstrate real potential, but they also show why benefits need precise definitions and context.
Lear has its own evidence that technology can generate value. Supply Chain Dive reported that the company's IDEA program, whose focus areas include industrial automation, saved more than $30 million in the first half of 2025. A global factory rollout should translate that enterprise-level value into plant-level operational drivers rather than applying one savings percentage everywhere.
For each candidate site, planners should build a low, expected, and high benefit case. The low case should assume realistic ramp losses, training needs, integration work, and product variability. Capital approval should still make sense under that conservative scenario.
Gate the rollout instead of copying the factory
A disciplined rollout uses evidence gates:
- Stabilize: The Michigan site sustains target safety, quality, throughput, and uptime for a defined period without launch staffing masking normal requirements.
- Normalize: Analysts adjust results for volume, product mix, labor rates, building constraints, and supplier distance.
- Match: Candidate plants receive readiness scores for data quality, container standards, maintenance capability, systems integration, and inbound reliability.
- Pilot: One comparable site adopts a bounded capability—such as AS/RS replenishment—before the full architecture is replicated.
- Scale: Funding is released only after the second site meets predetermined operational and financial thresholds.
The scorecard should also include stop conditions. Examples include inventory accuracy below the level required for autonomous moves, recovery time above the customer buffer, excessive manual overrides, or premium freight rising after deployment. A stop is not a failed strategy; it is protection against scaling an unresolved design problem.
Connect the factory blueprint to transportation
Automation compresses reaction time. When production consumes material faster and buffers shrink, late inbound shipments become more damaging. Transportation data must therefore feed the same operating cadence as production and storage data.
CXTMS can connect supplier appointments, shipment milestones, expected arrival times, and exceptions with plant requirements. Teams can identify when an inbound load threatens the next production window, prioritize the material that matters most, and measure whether a new factory design reduces total cost instead of shifting expense into premium transportation.
Lear's Michigan factory can become a powerful global model. The blueprint, however, should not be a fixed equipment list. It should be a tested combination of operating standards, data requirements, measurable outcomes, and rollout gates that another plant can reproduce.
Ready to connect inbound execution with your manufacturing network? Request a CXTMS demo.