Chili's Menu Consistency Starts With a Restaurant-Level Supplier Scorecard

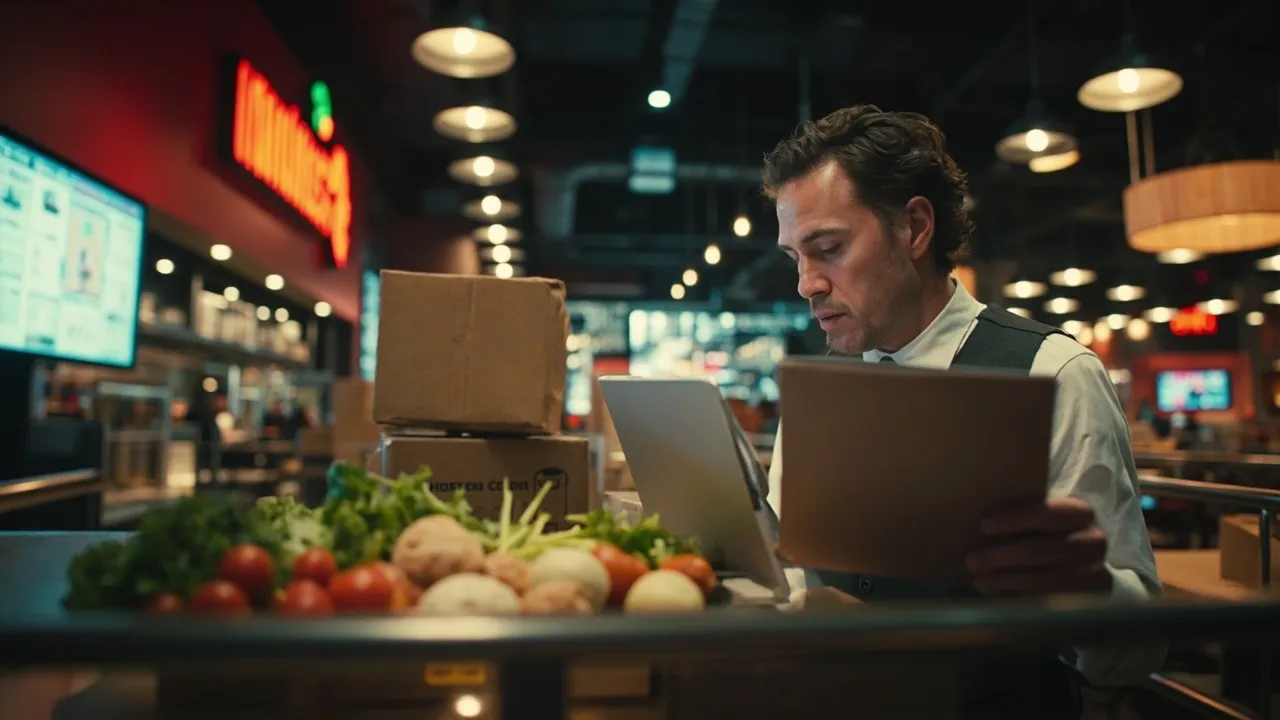
A guest ordering the same burger at two Chili's locations expects the same bun, portion, appearance, and taste. Delivering that experience is not only a kitchen challenge. It depends on suppliers meeting specifications, distribution centers filling orders, trucks arriving predictably, and each restaurant having the right ingredients when service begins.
Chili's recent supply chain work illustrates the connection. Supply Chain Dive reports that the chain increased delivery frequency from twice to three times weekly at some restaurants to support popular items. It also staged a new bun rollout: production began in January 2024 for 80% of restaurants, with the remainder in place by January 2025.
Those are network decisions, but their value is realized one restaurant at a time. A national fill-rate average can look healthy while a handful of locations repeatedly lose the same menu item. Foodservice operators therefore need a scorecard that traces supplier and distribution performance all the way to local menu availability.
Start with the guest promise
Traditional supplier scorecards emphasize price, aggregate on-time delivery, and quality claims. Those measures matter, but they do not fully answer the operating question: could every restaurant execute the advertised menu throughout the day?
Translate that guest promise into a short chain of measurable events:
- The supplier ships the correct ingredient to specification.
- The distribution center receives acceptable product and has it available for allocation.
- The restaurant order is filled without an unauthorized substitution.
- Delivery arrives within the restaurant's usable receiving window.
- The ingredient remains available through the expected demand period.
One failure can create several symptoms. A restaurant stockout might originate with a supplier short ship, an allocation rule, a late truck, an inaccurate local forecast, or waste caused by poor quality. The scorecard must retain those distinctions. Otherwise, the company may penalize a distributor for a supplier constraint or add inventory when the actual issue is specification failure.
Measure location-level availability, not just network averages
Inbound Logistics defines fill rate as the percentage of orders fulfilled completely from available inventory without lost sales, backorders, or stockouts. For restaurant networks, calculate it at multiple levels: supplier to distribution center, distribution center to restaurant, order line, case, and critical ingredient.
Suppose a distributor fills 98% of cases across a region. That appears strong, but the missing 2% may be concentrated in burger buns at five high-volume locations. Volume-weighted reporting can hide the exact failures customers notice. Add three complementary views:
- Restaurant perfect-order rate: the percentage of deliveries arriving complete, on time, damage-free, and within specification.
- Critical-item availability: the percentage of service periods in which every ingredient required for a promoted item is available.
- Stockout minutes: the time a menu item is unavailable, weighted by expected demand during that period.
These measures separate a small administrative shortage from a Friday-night outage. They also show whether an intervention improves the guest experience rather than merely moving a network average.
Build the scorecard around four controls
An effective restaurant supplier scorecard should concentrate on availability, quality, lead-time variance, and corrective-action closure.
1. Availability
Track ordered quantity versus shipped, received, and usable quantity. Record the original reason code for every short shipment and the party responsible. For critical ingredients, monitor consecutive misses and the number of restaurants affected. A supplier with a 97% average fill rate but repeated failures on one signature-item component is a greater brand risk than the average suggests.
2. Quality and specification compliance
Measure acceptance rate, temperature compliance, shelf life at receipt, packaging integrity, portion variance, and sensory or preparation failures. Tie each defect to its lot, supplier site, distribution center, restaurant, and menu item. This makes it possible to identify whether variation is systemic or limited to one facility or production run.
Chili's bun transition offers a useful model: a phased rollout creates checkpoints to validate production capacity and restaurant execution before full deployment. Keeping established suppliers after rollout can preserve process knowledge, but ongoing specification data is still necessary to prevent gradual drift.
3. Lead-time and delivery variance
Average lead time is less useful than its variability. Record requested, promised, shipped, DC-received, dispatched, and restaurant-received timestamps. Then score the spread around the promise, not only whether the average meets it. Higher delivery frequency can reduce restaurant inventory requirements, but it also creates more delivery events that must perform reliably.
Commodity pressure makes this discipline more important. In a separate report, Supply Chain Dive said Unilever raised prices across its portfolio by 2.3% in the third quarter in response to elevated commodity costs. When input markets tighten, suppliers may change sourcing, production schedules, or pack configurations. Scorecard alerts should surface the service and quality effects before they become restaurant surprises.
4. Corrective-action closure
Count open issues by severity, days outstanding, repeat occurrence, and verified effectiveness. Closing a ticket is not the same as fixing the cause. Require an owner, due date, containment step, root-cause statement, and evidence that performance remained stable after the change. Escalate recurring failures even when each individual claim appears small.
Govern substitutions as menu changes
Substitution can protect availability, but an untested substitute may alter taste, allergens, cook time, yield, or presentation. Track substitute requests separately from ordinary fill rate. The workflow should require culinary, quality, procurement, and operations approval based on the ingredient's risk.
Every approved substitute needs an effective date, affected restaurants, lot traceability, expiration rule, and instructions for operators. The scorecard should show both how often substitution prevented a stockout and whether it caused quality complaints or additional waste. This prevents availability gains from quietly weakening consistency.
Turn scores into weekly operating decisions
A scorecard is useful only when it triggers action. Set thresholds by ingredient criticality and route exceptions to named owners. A falling DC fill rate may trigger allocation review; rising lead-time variance may require a delivery-calendar change; repeated quality defects may pause a supplier line; a slow corrective action may escalate to an executive review.
Review performance weekly at the restaurant and distribution-center level, then monthly with suppliers. Compare restaurants with similar demand rather than treating every location alike. Preserve the link between purchase order, shipment, lot, delivery, inventory adjustment, stockout, and corrective action so teams can investigate an exception without assembling five spreadsheets.
CXTMS can connect supplier commitments, transportation milestones, delivery exceptions, and location-level performance in one operating view. That makes the scorecard a daily control system instead of a retrospective report—and helps protect the consistent menu experience guests expect.
Ready to turn supply chain events into restaurant-level accountability? Request a CXTMS demo to see how unified transportation visibility and exception management can support better supplier performance.