Asics Uses Warehouse Drones: Measure Inventory Confidence Before Labor Savings

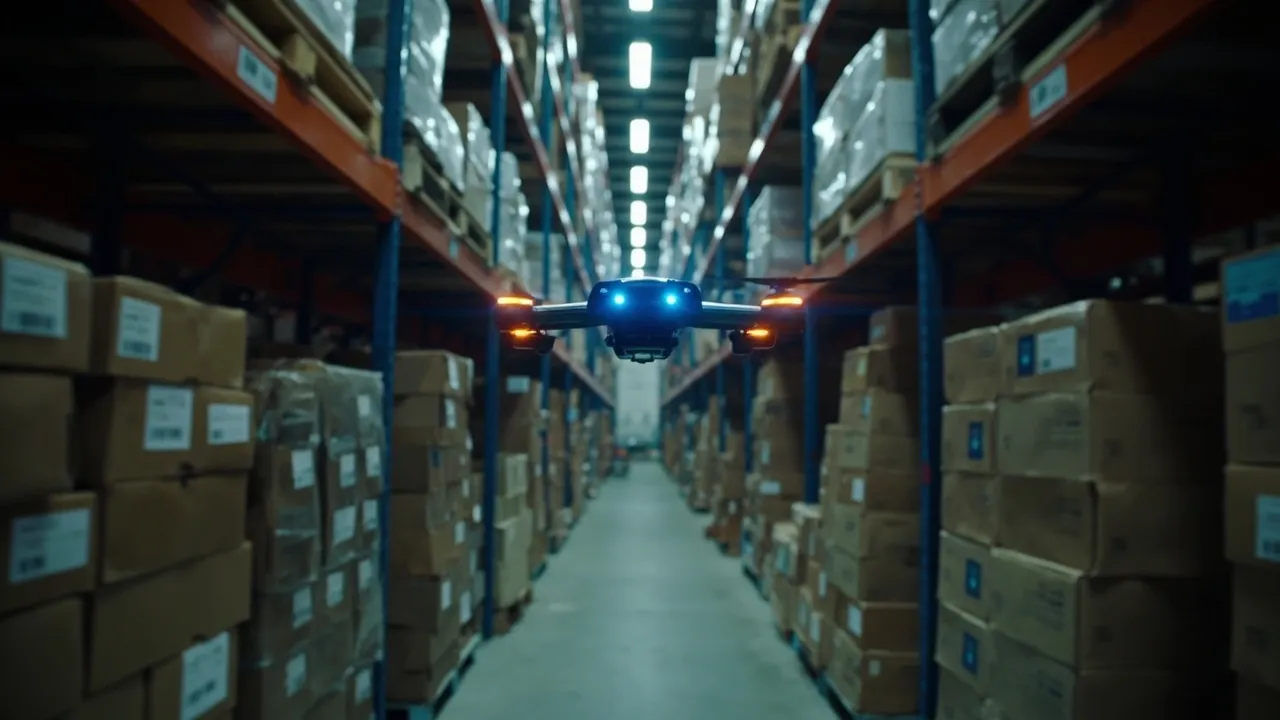
Warehouse drones are easy to justify as a labor-saving tool: fly an aisle, read labels, and reduce the hours employees spend on lifts counting pallets. But labor is not the most valuable result. The real prize is inventory confidence—the ability to accept an order because the product shown in the warehouse management system is actually available, identifiable, and accessible.
Asics offers a useful example. At its 855,000-square-foot omnichannel distribution center in Byhalia, Mississippi, the company stores nearly 3 million units across about 44,000 SKUs. According to Supply Chain Dive, autonomous drones helped Asics recover misplaced inventory 60% faster, identified 26 misplaced cases containing more than 200 pairs of shoes during one three-month period, and eliminated 200 labor hours. Yet the strongest business result was improved confidence in what the company could promise for sale.
Measure the inventory outcome, not the flight
Before the drone program, Asics manually counted critical sections twice a year. It now runs monthly counts in its singles area, which includes individual pairs and returns, and in case reserve, where full cases are stored. Seven nighttime flights scan UPCs and count boxes while normal picking is inactive.
That increase in count frequency matters because an error that remains hidden for six months can turn the final available pair into a canceled customer order. Asics previously held back as many as 15 of every 100 products from online marketplaces because it could not confidently fulfill demand at the tail of inventory. Better visibility lets the company list more stock instead of discounting products that were physically present but operationally unavailable.
Count speed and labor hours still belong in the business case, but they are input measures. Inventory confidence should answer four harder questions:
- What percentage of WMS location records match the drone observation?
- How quickly is a discrepancy verified, corrected, or escalated?
- How much previously unavailable stock becomes sellable after correction?
- Do customer-facing cancellations and pick exceptions decline?
A drone that captures thousands of images but leaves discrepancies in a queue has automated observation, not inventory control.
Reconcile three versions of warehouse truth
Every drone observation should be compared with both the WMS record and downstream execution. The first comparison is location-level: expected SKU, expected quantity or handling units, observed label, observed count, and confidence in the image. Classify mismatches as missing inventory, unexpected inventory, wrong location, unreadable label, count variance, or suspected duplicate.
The second comparison tests whether the mismatch affects operations. Connect the location to short picks, substitutions, canceled allocations, replenishment delays, and time spent searching. This prevents the team from treating every variance as equally important. A misplaced slow mover and the last pair promised to a customer may both be one discrepancy, but their service and revenue consequences are different.
The third comparison is physical verification. At Asics, inventory associates review flight paths, video, and images the next morning. Some issues can be corrected from a desk; uncertain cases require a person at the location. Record the verifier, finding, correction, root cause, and closure time. Do not let automated data silently overwrite the WMS, especially when returns, mixed SKUs, damaged labels, or nested cartons complicate interpretation.
Build an inventory-confidence score
Use a score that combines accuracy with operational recovery instead of reporting one impressive percentage. A practical dashboard should include:
- Location agreement: locations with matching item and quantity divided by locations observed.
- Observation coverage: eligible locations successfully scanned, excluding documented obstructions or unreadable labels.
- Exception aging: median and 95th-percentile time from detection to verified closure.
- Repeat variance: locations or SKUs that fail again within the next two count cycles.
- Recovered availability: units and value returned to sellable status after reconciliation.
- Execution impact: short picks, search time, cancellations, and emergency replenishments per 1,000 order lines.
Segment these measures by zone, SKU velocity, inventory status, and error type. A building-wide average can hide weak performance in returns, narrow aisles, high racks, or visually similar footwear sizes—the exact areas where confidence is most fragile.
There is evidence that the model scales beyond one footwear facility. Modern Materials Handling reported that Southern Glazer's expanded to more than 40 drones across nine distribution centers after roughly 5,000 flights identified more than 35,000 discrepancies. The distributor moved from quarterly to biweekly inventory measurement and reported a 100-basis-point increase in cases processed per hour. Those figures reinforce the point: frequent observation becomes valuable when it improves execution.
Set a rollout gate before adding facilities
Define success before the pilot begins and require several stable cycles before expansion. The rollout gate should cover four categories.
Accuracy: The drone must meet agreed thresholds for location agreement, label readability, and count confirmation in each target zone—not merely across the easiest aisles.
Exception closure: The operation must prove that staffing, workflows, and WMS controls can resolve findings within a service-level target. Backlog growth is a failed pilot even if detection is excellent.
Safety and continuity: Flights need approved routes, charging and battery procedures, obstacle rules, emergency stops, incident logging, and defined separation from people and equipment. Test network loss and incomplete missions. Nighttime operation may reduce interference, but it does not eliminate governance.
Business recovery: Require measurable improvement in sellable inventory, short picks, cancellations, search time, or order fill. Labor reduction should be counted only after including review, verification, maintenance, integration, and exception-handling effort.
Use a control zone or comparable pre-deployment baseline so seasonal SKU changes do not receive credit as automation gains. If accuracy improves but repeat variance remains high, investigate receiving, putaway, replenishment, returns, and picking processes. Drones expose errors; they do not remove the process that created them.
Connect warehouse confidence to transportation promises
Inventory accuracy becomes commercially useful when it supports a reliable order promise. Warehouse teams should share confirmed availability and exception status with order and transportation workflows before a load is planned. That reduces late shipment changes, partial tenders, avoidable expedites, and capacity booked for product that cannot be found.
CXTMS helps logistics teams coordinate orders, shipment plans, carrier milestones, documents, and exceptions in one transportation workflow. Request a CXTMS demo to see how stronger inventory signals can translate into more reliable freight execution and customer delivery promises.